Two Years of Space Traffic: Current Trends in New Payloads and Debris in Orbit
This article originally appeared in Orbital Debris Quarterly News, Volume 27, Issue 2, June 2023. Past issues of ODQN are available here.
The NASA Orbital Debris Program Office (ODPO) maintains an internal database based on information available in the U.S. Satellite Catalog to define the historical, current, and predictions of the future state of the objects in Earth orbit. Each satellite is assigned an object type (spacecraft, upper stage, or debris), size, and wet and dry mass, if known, which are used within models of the orbital evolution of objects to assess orbit lifetime, the likelihood of collisions and explosions, and to estimate how they may influence the orbital debris environment directly or indirectly, singly or in aggregate.
Over the past two years, an average of 975 new tracked objects have been added to the catalog each quarter. New objects are added to the catalog when they are initially released on independent orbits, whether by a launch vehicle, a parent spacecraft during normal operation, or an anomalous event or breakup event.

Independent objects temporarily attached to another object and released again later, such as a Dragon spacecraft docked to the ISS or a Shenzhou spacecraft docked to the Tiangong space station, are only counted once and do not get a new designation upon re-release. An analysis of the number and mass of different classes of objects illustrates trends in the space industry and the orbital population. Knowledge of these trends in how the space environment is being used can help inform space policy.
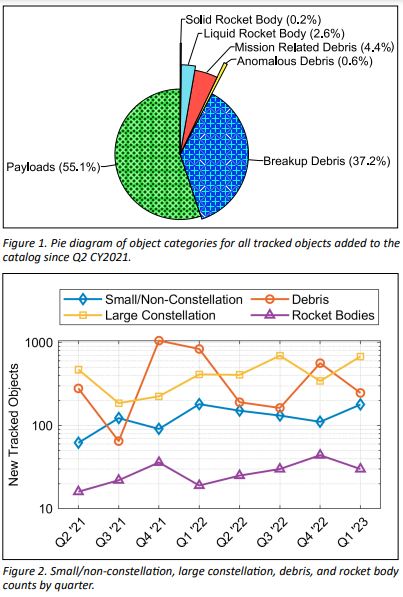
Figure 1 compares broad categories of new objects added to the catalog from the second quarter (Q2) of calendar year (CY) 2021 to Q1 CY2023. Over a third of all new objects came from the fragmentation of existing satellites (37.8% total). Mission-related debris (MRD), or inert objects released by a satellite during normal operation, accounted for 4.4% of all new objects. The majority of these are payload encapsulation or attachment hardware released during spacecraft deployment. Spent rocket bodies and orbit insertion motors accounted for 2.8% of new objects. The remaining 55.1% of objects that added to the space traffic from Q2 CY2021 through Q1 CY2023 are spacecraft. Some trends are also evident in a quarter-by-quarter look at relative numbers of objects in four main categories.
Figure 2 shows the number of new objects each quarter in the debris, large constellation (over 100 satellites), small constellation/single satellite payloads, and rocket bodies’ category. Over the past two years, the launch cadence has increased. It should be noted that the number of rocket bodies in the catalog do not represent all launches, as many larger rocket upper stages perform a targeted de-orbit burn at end of mission and are never tracked for more than one or two rotations. The launch cadence also shows a periodicity, with fewer launches in the first quarter and a slow ramp-up over the course of the year.

The number of debris objects added to the catalog at any given time is largely driven by a background rate of MRD production and discrete breakup events. Generally, the background rate of MRD production is 40 to 80 objects per quarter with another 50 to 100 objects added every quarter from old breakup events and small anomalous events. In Figure 2, two peaks in debris object creation correlate to two large breakup events: the Russian anti-satellite (ASAT) test on Cosmos 1408 on 15 November 2021 and the breakup of a Long March 6A upper stage on 13 November 2022.
Large constellation launches have placed a relatively steady number of objects into orbit for most of the last two years and comprise more than half of all payloads launched. A short, two-quarter lull in large constellation payloads occurred in the final two quarters of 2021, during which several legal stays on further Starlink launches were requested.
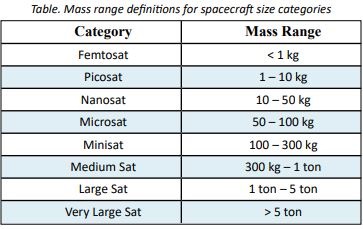
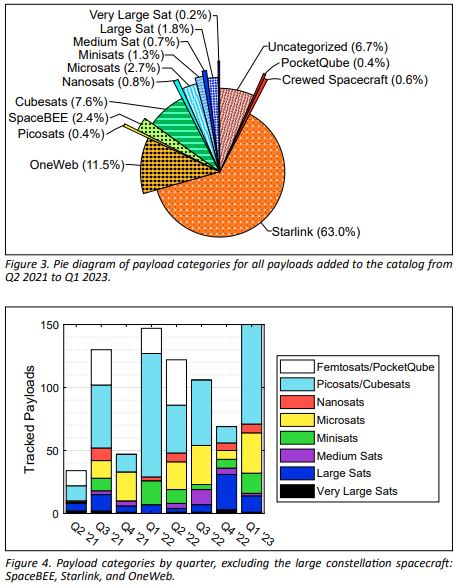
Breaking down the payloads by size and membership in a large constellation highlights some of the reasons that payload launches have increased. The satellite community uses various categories for different masses of satellites, and these may vary in definition depending on source. For purposes of this analysis, the categories of satellites as a function of mass are defined in the Table. Figure 3 shows the category breakdown of all payloads for the last two years, and clearly indicates the recent trend towards large constellations and small payloads; nearly three quarters of all payloads are members of a large constellation and over half of the remaining payloads have a mass of less than 100 kg each. Nearly 8% of all payloads are CubeSats with dry masses under 15 kg. Less than 7% of payloads did not have sufficient information for classification, thus marked as uncategorized in Figure 3.
The number of small constellations (with fewer than 100 members, such as FLOCK, LEMUR, and GlobalHawk) and single-satellite payloads launched has also increased since 2021, as shown in the total objects for each quarter in Figure 4. This increase is mostly driven by ride-share launches, dedicated multiple deployment missions like SpaceX’s “Transporter” launches, a burgeoning launch market for dedicated sub-100 kg payloads, and technology advances that allow more functionality in smaller, lower-mass packages. With the exception of Q4 2022, the overall trend in launching massive (payloads > 5 tons) is minimal; less than 15 payloads over the course of two years have exceeded this metric with Q4 2022 accounting for 3.
This is in contrast to the number of small satellites (< 0.5 ton) that, on average has risen over the past two years. Satellites smaller than 30 kg (Picosats and smaller) make up more than half of these smaller payloads almost every quarter, and even smaller form-factor satellites are becoming popular, with more than half of all PocketQube spacecraft (Femtosats) ever launched making it to orbit in 2022. Monitoring the historical space traffic environment allows the ODPO to project future space traffic and statistically assess a realistic space debris environment attributable to explosions and collisions.
This provides the ODPO with the tools it needs to develop models that can be used to understand mission risk and evaluate realistic and actionable mitigation options. Additionally, monitoring space traffic can identify important trends in the space industry and the influence of these trends on the environment.